Project Summary
Data science project analyzing SpaceX Falcon 9 launch outcomes using Python, SQL, Pandas, and NumPy. Built interactive visual analytics using Folium and Plotly Dash, and trained classification models with Scikit-learn to predict first-stage landing success. Includes data collection via APIs/web scraping, feature engineering, model evaluation, and visualization.
SpaceX Launch Analysis
End-to-end data science project analyzing Falcon 9 launches and predicting first-stage landing success.
Project Overview
This project explores SpaceX Falcon 9 launch data to understand what factors influence successful first-stage landings. I collected data from multiple sources (APIs and web scraping), cleaned and transformed it, performed exploratory data analysis, built interactive visualizations (maps and dashboards), and trained classification models to predict landing outcomes.
Key Highlights
- Data Collection: Pulled Falcon 9 launch data using APIs and web scraping.
- Data Wrangling: Cleaned, transformed, and engineered features for modeling.
- EDA: Explored relationships between payload mass, orbit type, launch sites, and success.
- Interactive Mapping: Used Folium to visualize launch sites and outcomes.
- Dashboarding: Built a Plotly Dash app for interactive analysis.
- Predictive Modeling: Trained and compared classification models to predict landing success.
Technical Stack
Data & Analysis
Python Pandas NumPy SQLVisualization
Matplotlib Seaborn Plotly FoliumDashboard
Plotly DashMachine Learning
Scikit-learn Logistic Regression SVM Decision Trees KNNLeadership & Contributions
I completed this project end-to-end: collecting data, cleaning and engineering features, performing EDA, building interactive maps and dashboards, and training multiple machine learning models to compare performance.
- Collected launch records using APIs and web scraping; standardized fields for analysis-ready datasets.
- Performed EDA to evaluate relationships across payload mass, orbit type, launch site, and landing outcome.
- Built interactive Folium maps and a Plotly Dash dashboard to communicate insights and filter results.
- Trained and compared multiple classifiers (Logistic Regression, SVM, Decision Tree, KNN) using Scikit-learn.
- Evaluated model performance using test splits and classification metrics, including a confusion matrix.
Results
The analysis showed that variables such as payload mass, orbit type, and launch site are associated with landing outcomes. I compared multiple classification models and selected a best-performing approach based on test accuracy and overall classification metrics.
Deliverables include cleaned datasets, visual analytics, an interactive dashboard, and a reusable predictive modeling pipeline.
Key Insights
- Launch Site Differences: The distribution of successful launches varies by site (visualized in the success-by-site chart), indicating location and operational factors matter.
- Payload vs Outcome: The payload scatter plot shows separations between success and failure clusters, suggesting payload mass influences landing outcome.
- Model Validation: The confusion matrix demonstrates how well the classifier predicts landings vs non-landings, providing interpretable performance evidence beyond accuracy alone.
Visual Highlights

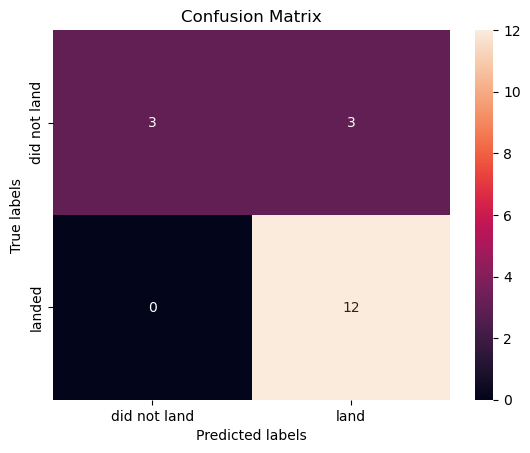
Visual artifacts include interactive mapping concepts (Folium), dashboard-style charts, and model evaluation outputs (confusion matrix) used to validate classifier performance.